Development of software “key indicators”
Category: Information Systems
As an environment for development and a meta-level for data storage Microsoft Access 2000 was used.
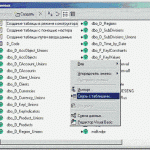
Using internal MS Access abilities to create links with tables from almost any DB, we established links with tables from the Key Indicators data warehouse and with tables designated for export of data on average price per product from the lower-level system. This approach allows using MS Access data base as a meta-level for integration of data on key indicators and developing applications which are practically independent of the physical level of data storage. The software «Key Indicators» was tested under SQL Server 7.0, Oracle 8i and in a single-user version (warehouse data kept in Access DB).
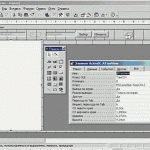
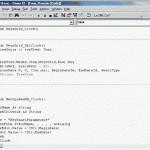
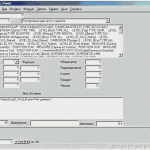
Microsoft Access 2000 is an ideal tool for developing simple applications to work with DBs. Using wizards and constructors for developing screen forms and queries and Microsoft Visual Basic for Application, TACIS IT experts developed 30 screen forms and more than 20 queries to enter and edit dimensions and their groups (key indicators, clients, regions, goods, subdivisions, currencies, units of measure), to enter and edit key indicators and limits for them and to import data on average price per product from the current operational system.
When developing screen forms of Key Indicators, experts used following the ActiveX components:
MSComctlLib.TreeCtrl.2 (to switch between tree-like and list presentation of Key Indicators)
MSFlexGridLib.MSFlexGrid.1 (to display key indicators within selected time interval; to “colour” values of a key indicator).
You can display Key Indicators in two ways:
As a tree (you will see a tree-like structure of key indicators and value of indicators which are located in the selected and “expanded” branch of the tree)
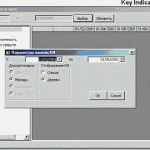
As a list (you will see the complete list of key indicators together with their values for the selected time interval)
When working on the Panel of Key Indicators ADO technology was also employed to handle queries to data warehouse.
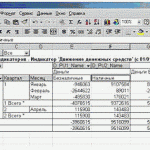
The so-called ”Drill-in” procedure for a key indicator, which means disaggregating of this indicator into its organic dimensions, was developed with Microsoft OLAP Cube technology.
This procedure, initiated by a user, builds a local OLAP Cube using data of the Key Indicators data warehouse. Afterwards, it is transferred to Microsoft Excel 2000 via technology OLE, MS Excel 2000 macros and Microsoft Visual Basic for Application. In Microsoft Excel 2000, the OLAP Cube is presented via pivot tables.
The body of a query on building OLAP Cube is transferred to a separate MS Access table that enables altering of the level of drilling in key indicators regardless of application. So, to add or change the list of key indicators one should not break into the source code of an application, minimal modification of the query’s body will be enough.
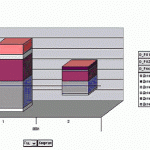
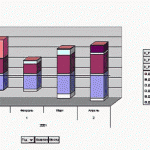
Pivot tables in Microsoft Excel 2000 allow not only automatic summation of values in columns and lines and their groups but also to simultaneously change the graph which corresponds to the respective table. Easy and flexible work with tables will enable managers to regulate the level of data aggregation by year, quarter, day, tree of indicators, client, region, product and subdivision.
More information on the software «Key Indictors» can be found in KI _User manual and KI _Programmer manual.

