PORTFOLIO CONCENTRATION AND CORRELATION RISK
Category: Risk Management in Banking
Both correlation risk and concentration risk are related measures of portfolio risk. Correlation risk relates to the loss association. Concentration risk designates here the effect of size discrepancies. Pure correlation risk is measured by the 30% asset correlation, independent of the sizes of exposures. Pure size concentration is measured by a concentration index, such as the diversity score, or concentration curves.
Diversification and Correlation Effects
In general, when the risks of two obligors correlate, the risk is higher if they have large exposures. There is an interaction between size and correlation. A simple measure combining these effects is the ratio of the portfolio loss volatility, 221.1, to the sum of individual standalone loss volatilities, 750.17 or 29.47% in our example. The portfolio diversifies away close to 70.53% of the standalone loss volatilities.
Concentration Risk: Diversity Score
Concentration characterizes size discrepancies. The individual loss given default weights, ratios of the individual loss given default to the total loss given default of 6000, measure exposure sizes. Synthetic views of portfolio size concentration, other than reporting the largest individual weights, include such measures as the diversity score and concentration curves.
The diversity score is an index synthesizing the discrepancies of exposure of individual facilities. There are as many concentration indices as there are metrics for risk. Alternative metrics include exposure weights, loss given default weights or capital allocation weights, each of them being the ratio of the individual measure to the total portfolio measure. There is a concentration index, or diversity score, for each metric. The diversity score is a number that is always lower than the actual number of facilities, here 50. The lower the ratio, the higher the risk concentration along the selected dimensions. The diversity score is the number of equal size exposures equivalent to the weight profile of individual exposures. The diversity score DS is the following ratio:
The w are the weights of facilities, using one risk metric, for instance exposure or loss given default of individual facilities. If all weights were equal to 1/n, with n the number of obligors, the ratio would be 1/(J^n= 1 1/n2),or 1/(n/n2) = n. The diversity score is commonly interpreted as the number of uniform exposures equivalent to the number of actual unequal exposures. It is a convenient measure to capture pure size concentration effects, as opposed to correlation effects. The ratio of the diversity score to the actual number of exposures is always lower than 1 whenever there are size discrepancies, and the gap measures pure concentration risk.
Table 55.2 provides the diversity scores for exposure and capital allocation, respectively equal to 35.02 and 33.22. Both numbers are lower than the actual number of exposures, 50. The ratios of these diversity scores to this actual number of exposures, 50, measure the level of concentration in terms of weight discrepancies. Note that the capital diversity score combines both effects, concentration and diversification, since capital allocations capture the retained risk post-diversification effect.
Concentration Curves
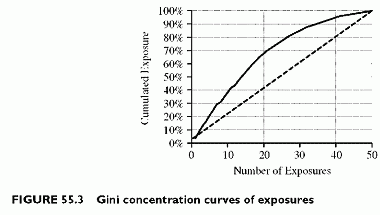
A second measure of concentration risk is the concentration curve, or Gini curve. The curve shows the cumulated exposure, or any alternative risk metric, such as capital, as
a function of the number of exposures. The curve cumulates the risk metric (exposure) sorted by descending values. A uniform exposure portfolio would have a straight-line concentration curve. The higher the curve above the straight line, the higher the concentration risk.
In the exposure concentration curve of Figure 55.3, the first five biggest obligors represent 21% of the total portfolio exposure, the first 10 biggest obligors represent 40% of the total portfolio exposure, and so on. The curve hits 100% when all 50 exposures cumulate. The slope is steeper at the beginning of the curve because the largest exposures are the first along the X-axis. Steepest slopes also characterize concentration because they imply that a lower number of the largest risks concentrates a larger fraction of the total risk.


