SIMPLIFIED EXTENSION WITH INDEPENDENT DEFAULT EVENTS
Category: Risk Management in Banking
When default events are independent, and have the same probability, the distribution of the number of defaults in a portfolio is the binomial distribution. Unfortunately, the binomial distribution cannot capture the effect of size discrepancies and correlations. We use it here to see what happens when the number of obligors increases.
The Binomial Distribution
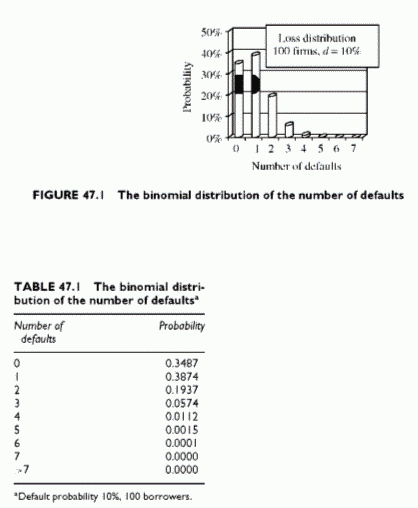
Using a simple default probability of 10%, and 100 obligors, Figure 47.1 shows the distribution of the number of defaults. Although the distribution has the fat tail characterizing credit risk loss distributions, this distribution falls short of a realistic correlated loss distribution. Nevertheless, the binomial distribution provides a good introduction to credit risk loss distributions (Table 47.1).
Simulating Increased Diversification with Loss Independence
Increasing the number of obligors reduces the loss volatility without affecting the mean loss. It is surprising how quickly the loss volatility converges towards zero.
Loss Volatility with a Binomial Distribution
There are two views of the loss distribution of a portfolio when losses are independent. Either we see the total loss as following a binomial distribution, or we consider the same loss as the sum of individual random unit losses. The two approaches are identical.
Looking at the portfolio loss distribution as a binomial distribution, the variance of the distribution is N x X2 x d x (1 — d),where N is the number of exposures, d is the default probability, 1 — d is the non-default probability and X is the uniform exposure on each borrower. Alternatively, the same portfolio loss is the sum of all random individual losses. Each random loss is the exposure X times a Bernoulli variable with value 1 in the event of default (with probability d) and value 0 in the event of no default (with probability 1 — d). The summation has a variance that is the sum of all individual loss variances, since losses are independent, which is N times the individual identical loss variances. The individual borrower variance is X2 x d x (1 — d) and the portfolio variance is N x X2 x d x (1 — d), as above. The volatility is the square root of this sum.
With N exposures, of unit value size X = 2, the unit variance in value is 10% x (1 — 10%) x 22 = 0.36 and the total variance is N x 0.36. The loss distribution volatility in value is the square root of this.
The Effect of Diversification
It follows that each additional exposure adds the same constant amount to the portfolio loss variance X2 x d x (1 — d) = 0.36. The loss volatility increases as the square root of N, less than the loss variance that is proportional to N. The additional volatility is the difference between the loss volatility with N + 1 exposures and the loss volatility with N exposures.
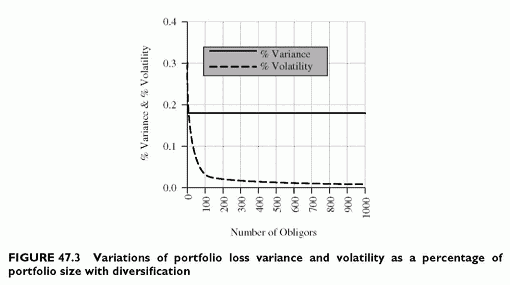
The portfolio loss volatility, as a percentage of total exposure, decreases with -JN and converges to zero when N increases.
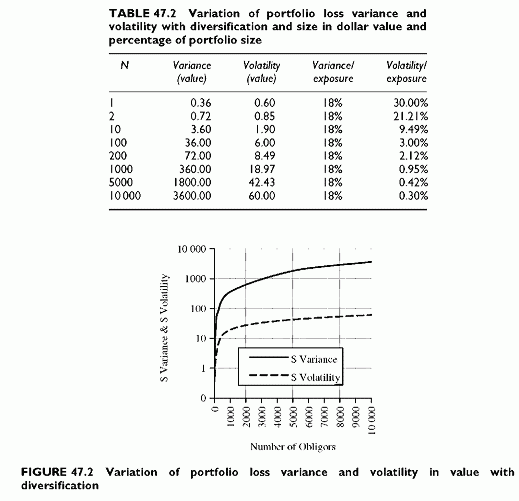
In the sample calculation below, N increases from 1 to 10 000, with the same other parameters as above. Table 47.2 shows the variance and the volatility, in value and as a percentage of total exposure, when increasing the number of obligors N from 1 up to 10 000. The ratio of variance to exposure remains constant at 18%. The additional volatility in value is also a constant, and decreases as a percentage (Figures 47.2 and 47.3).
This confirms the well-known result that the loss volatility as a percentage of portfolio size tends towards zero.


