STRUCTURING CDO NOTES
Category: Risk Management in Banking
Structuring notes requires defining the number and size of each note based on the risk characteristics of the portfolio of assets serving as collateral. The common philosophy for structuring and rating notes is to use stressed, unexpected losses to check that each class of note sustains such stresses without loss. The rating depends on the level of stressed losses that triggers the first loss of various seniority level notes. The actual practice uses a more comprehensive testing of all scenarios possible for all relevant variables, including the effects of all covenants, in order to check that the assigned rating corresponds to the resiliency of each note.
Portfolio models because they provide the entire distribution of losses, unexpected losses and their probabilities, rather than single stressed values whose low probability of occurrence is largely judgmental.
This section illustrates the potential contribution of portfolio models for structuring and rating notes of CDOs. Nevertheless, it remains much simplified because it ignores the technicalities and effects of covenants.
The Principle
The principle is to generate a loss distribution and to allocate each random value of the portfolio loss to each one of the structured notes, following the waterfall of losses according to their seniority levels. However, this simple example ignores covenants and simply passes on the portfolio losses to notes.
It is possible to derive the loss distributions of each structured note from the portfolio loss distribution. This makes the calculation of the average loss of each structured note feasible, providing an objective basis for rating them. This avoids the judgmental component of selecting ad hoc stressed values of unexpected losses, based on history or experience. To redesign the structuring of tranches, for example changing their sizes, it is possible to test several size structures and find what minimum sizes guarantee a given rating, depending on the risk characteristics of the portfolio.
The next subsection explains how to derive the loss distribution of each structured note from the portfolio loss distribution. The third subsection shows how to generate a sample loss distribution for a fictitious simple portfolio and how to calculate the expected loss of all five classes of structured notes in the example. The fourth subsection provides an example of the calculation of structured note expected losses using a Monte Carlo simulation to generate the portfolio loss distribution.
The Portfolio Loss Allocation to Structured Notes
The loss of any structured note depends on the aggregated level of losses of a portfolio of loans. Losses flow to structured notes according to their seniority level. Any note benefits from the protection of all subordinated notes, whose total size determines the level of over-collateralization of the structured note, characterizing its the seniority level. The total size of all subordinated notes under a specific note is a loss franchise benefiting the next senior tranche.
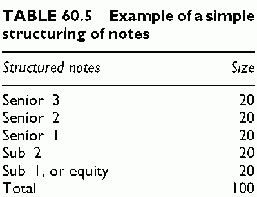
The loss allocation is very simple. A portfolio has a size of 100. There are five classes of structured notes, each having an equal size of 20. A tranche gets more senior when moving up. The lowest tranche is Sub 1, serving as equity for the others since it gets hit by any first loss of the portfolio. The most senior tranche is Senior 3, on top (Table 60.5).
The exercise is to allocate loss. The portfolio loss can range from 0 up to 100, although this 100 loss will never happen. If the loss is lower than 20, it hits Sub 1. If it is above 20, the excess over 20 hits the upper tranche. Hence a 25 portfolio loss results in a total loss of 20 for Sub 1 and 25 — 20 = 5 for Sub 2. Following the same rationale, the allocation of a large portfolio loss of 45 would be 20 for Sub 1, 20 for Sub 2, 5 for Senior 1 and 0 for both Senior 2 and 3. Of course, the likelihood of these losses varies, with high losses exceptional and small losses frequent, as usual.
The Loss Distribution of Structured Notes
Using this mechanism, we can reconstruct the loss distribution for each structured note, and derive from this loss distribution its expected loss.
The loss distribution of each note has a lower bound of zero. This corresponds to a portfolio loss equal to or lower than the seniority level measured by the total size of lower rated notes. For example, the Senior 1 note has a loss of 0 when the portfolio loss is 40 and a loss of 1 when the portfolio loss reaches 41. Simultaneously, each note loss has an upper bound, which is simply its size. In our example, Senior 1 cannot lose more than 20. In order to have this 100% loss level, the portfolio loss should hit the value 60.
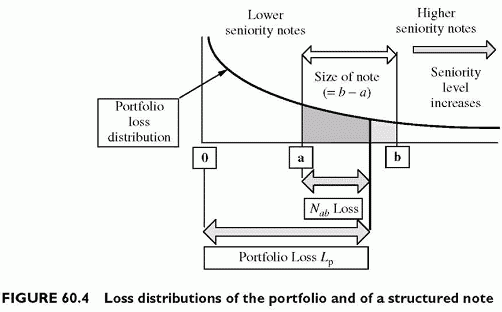
The random loss of the portfolio is Lp, the random loss for the note Nab benefiting from the seniority level a and of size b — a is Lab. The size of the note is Nab = b — a, and this difference is the maximum loss of the note. For any given portfolio loss Lp,we
can calculate the loss for the structured note Nab. Figure 60.4 shows both the portfolio loss and the loss for note Nab.
Analytically, the loss for the note is Lab = min[max(Lp — a, 0), b — a]. The first loss appears only when Lp passes the lower bound a. If the portfolio loss Lp gets bigger, it remains bounded by b — a, the size of the note Nab. Any excess above this cap hits the next structured note. The expected loss results from the portfolio loss distribution truncated at the levels a and b1 .
Example of Structured Note Loss Distributions and Expected Losses
In order to illustrate the above methodology, we use the example of the portfolio funded by five classes of structured notes, inclusive of equity (note Sub 1). The portfolio characteristics are: 100 obligors, uniform unit exposure, uniform default probability of 5%, recoveries of zero and a uniform asset correlation of 30%.
In order to determine expected losses, we generate a loss distribution using the simplified asset model. The number of simulations is 1000. By allocating the portfolio loss to all structured notes at each run, we also generate the loss distributions of the structured notes. The expected loss of each note is simply the arithmetic average of losses hitting each tranche across all 1000 trials. Table 60.6 summarizes the results.
With 30% correlation, there is no loss in the 1000 trials for Senior 1 and Senior 2. The three most senior notes are investment grade, since the expected loss is 0.059% (rounded to 0.06%) for Senior 3. For the subordinated notes, the expected loss is much higher. Surprisingly, it is always lower than the average loss of the portfolio. This average simulated loss is 4.98%, very close to the 5% value. This results from the upper bound of loss that exists for each note. There is no way to lose more than the amount of the note, or 20% of the total portfolio size.
For moving from expected loss of each note to its rating, we can use the equivalence between the default probability of a senior unsecured issue and the default probability. According to the default frequencies from rating agencies of Chapter 36, note Senior 1 has a rating slightly better than a single A in the simplified scale of six rating classes, Sub 2 is a Baa note, and the equity tranche is a single B.
The process models the expected loss and the rating equivalent of all notes issued from the loss distribution of the collateralized portfolio. The mechanisms apply whatever the sizes of structured notes and allow us to test various structures or target the structure of notes according to desired ratings and the targeted clientele of investors. The limitations of this simple model are that it does not embed all covenants that also mitigate the credit losses and trigger early termination. Subject to this limitation, it covers the spectrum of all loss scenarios rather than using discrete stress scenarios selected judgementally among all possible scenarios included in the simulations.


