THE PORTFOLIO
Category: Risk Management in Banking
The three chapters use the same sample fictitious portfolio for illustrative purposes. This section briefly summarizes the characteristics of the portfolio.
Portfolio Details
The portfolio used throughout the three chapters, comprising 50 obligors, is detailed in the appendices. There is one facility per obligor, with different exposures, loss given default percentages, default probabilities and All-In Spreads (AISs). The maturity is 1 year for all facilities. Facilities are in two risk classes, whose default probabilities are 1% and 2.5% respectively. There are two business units (V and W) and two industries (A and B). Facilities have unequal exposures, from 50 to 500, and loss given default percentages ranging from 20% to 100%. Exposures are at book value. The portfolio is subject to a uniform correlation of 30% between the obligors assets. The loss distribution results from a Monte Carlo simulation with 50 000 runs. The methodology for generating the loss distribution uses the simulation of asset values using standardized normal distributions with a uniform correlation of 30% across asset values, and threshold asset values triggering default events adjusted to the 1% and 2.5% default probabilities. The revenues are AISs. The accounting return on asset is the ratio of the AIS over total exposure. The risk-adjusted return is the ratio of AIS minus expected losses to economic capital. The simulation uses the one-factor model, with a common factor for general risk and an independent residual for specific risk.
All portfolio statistics result from the Monte Carlo generated loss distribution. For individual facilities, standalone loss volatility and expected loss result from exposures, loss given default percentages and default probabilities. Economic capital and portfolio loss volatility result from the loss distribution. Capital allocations of overall economic capital are proportional to the standalone loss volatilities of facilities. Such allocations are identical to absolute risk contributions for a uniform correlation portfolio.
Ex post values of RaRoC and SVA for the entire portfolio, and each individual facility from AISs, result from revenues, economic capital and capital allocations. Capital is in excess of expected loss or expected spread. The cost of capital, pre-tax and pre-operating costs, is k = 25%.
Portfolio Loss Distribution
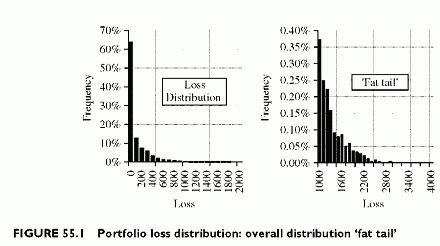
We visualize in Figure 55.1 the entire loss distribution, plus a zoom in on the fat tail, for both the probability density distribution and the cumulated distribution.
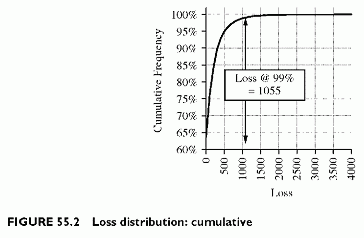
The total exposure is 11000, before recoveries. Figure 55.2 shows the cumulative distribution, from which loss percentiles derive, and the fat tail frequency distribution. The loss at the 99% confidence level is 1055, or 9.59% of the total exposure of 11 000, and 17.58% of the total loss given default of 6000. These are relatively high numbers, resulting from the choice of both a small portfolio and high default probabilities, which are in the speculative grade zone of the rating scale.


