TRADING CREDIT RISK
Category: Risk Management in Banking
Credit derivatives allow us to trade credit risk as a commodity, in isolation from the underlying assets, such as interest rate and foreign exchange risks. In addition, there was no way to hedge credit risk until the appearance of credit derivatives. The insurance function of instruments is not the unique key factor. Others are the ability to trade risk off-balance sheet without making cash transactions and the ability to trade different expectations on the same underlying credit risk, making the credit risk market more efficient.
Trading Portfolio Risks
Banks have different costs of funding. Bank A has a relatively low cost of debt, making a loan to customer X profitable enough to compensate the capital charge. Another bank B has a higher cost of funding, making a loan to X not profitable enough to compensate the capital charge, either regulatory or economic. Bank A might lend, keep the loan on its books and sell the credit risk to bank B for a fee. Since bank B is now at risk with bank A, it benefits from a capital saving compared to lending to X as long as the seller bank A has a better rating than the borrower B. In addition, bank B gets the fee. The risk-adjusted return for both banks might increase through such transactions. In addition, bank B now has a way to gain a profitable exposure, which was not possible through X.
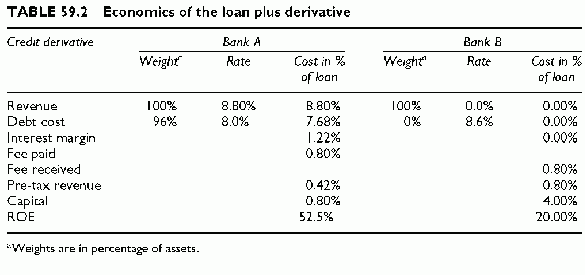
We expand the example using regulatory capital. The weight for the private corporation X is 100% and the weight with a banking counterparty drops to 20%. The capital charge with the direct loan is 4% (50% times 8%) and becomes 1/5(4%) = 0.80% for bank A, the direct lender, when it sells the risk to bank B, the buyer of the risk of A. Bank As pre-tax revenue decreases by the fee paid for the credit protection by bank B, say 0.80%, while bank Bs revenue increases by the same fee. Bank B has no funding cost, has the fee as pre-tax revenue and has a capital charge equal to the full 4%, the same as lending directly to X:
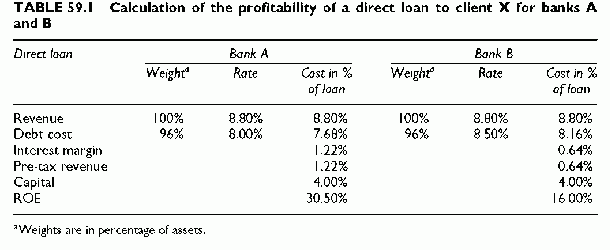
In the calculations of Table 59.1, we use a client rate of 9.10%, a cost of funding for A of 8% and a cost of funding for B of 8.50%. The capital structure is 96% debt and 4% equity. The cost of debt as a percentage of assets is 96% times the cost of funding, or 96% x 8% = 7.68% for A and 96% x 8.5% = 8.16% for B. The interest margin, the difference between the customer rate and the banks weighted cost of debt, is 1.42% for A and 0.94% for B. Direct lending to X results in a 30.50% Return On Equity (ROE) for bank A and 16.00% for bank B.
Post-credit derivative transaction, bank As revenue diminishes by 0.80% and bank Bs revenue becomes 0.80%. Bank As capital decreases to 1/5(4%) = 0.80% (if the capital charge for bearing the risk of bank B is 1/5 of the capital charge when lending to B) and bank Bs is at the full 4%. The resulting ROE becomes 52.5% for bank A and 20% for bank B. The transaction increases the capital profitability of both banks. The same could happen with economic capital, so this capital arbitrage is not only regulatory (Table 59.2).
Trading Expectations on the Same Risks
Default probabilities and recoveries are uncertain parameters. In both cases, statistics remain unreliable and internal ratings or default probability models are not necessarily accurate. Whatever such uncertainties, credit spreads embed expectations of default probabilities and recoveries. If different parties have different views on future recoveries, they can trade these views with default derivatives. Given the individual banks biases in perceptions of the same risks, there is a market for credit risk expectations.
One way to summarize both uncertainties is to refer to loss rates, or the default rate times the loss given default rate. For instance, a default probability of 1% combined with a recovery rate of 20% results in a loss rate of (1 — 20%) x 1% = 0.8%. Conceptually, the same loss rate should approximately result in the same spread. In practice, this is not so because banks use different combinations of default probability and estimates of recovery rates resulting in different loss rates and pricing. Looking at banks as price makers based on expectations, the differences in loss rates could be arbitraged.
Bank A might estimate a loss rate of 1%, bank B of 0.6%. If this is the case, it is possible to trade the differences in expectations about loss rates. Bank A prices the loan at 1% and bank B at 0.6%. Bank A can sell the deal to bank B at 0.6% or above, as long as it gets a profit of 1%. Since bank B is ready to buy at 0.6%, it can purchase from bank A at higher than 0.6%, as long as it requires less than 1%. This is a direct trading of expectations. Trading can also occur through derivatives. Bank A can enhance its return by selling a protection guaranteeing a net 0.6% to bank B. Bank B will pay the protection. This will enhance bank As return and decrease bank Bs return. If the price of protection is 0.2% for instance, the 0.2% enhances bank As return up to 1.2% and bank B pays the protection through a lower return 0.8% — 0.2% = 0.6%.
Note that trading risk expectations is not the same as trading different risk contributions of a given asset to different portfolios. Banks can trade the same asset without any discrepancies in expectations, simply because the same asset has different risk contributions to their specific portfolios.
Trading Credit Spread Expectations
Expectations on future spreads differ from forward spreads. The seller of a forward spread believes that the spread will actually be lower than the buyer does. The buyer fears a spread widening, thereby losing value. The seller bets that future spreads will be lower than the forward.
For instance, a forward spread, 2 years from now, on a longer maturity deal is 40 basis points (bp). The protection buyer fears that the spread will be higher 2 years from now. The seller bets that it will be lower. The seller sells forward this spread. If the future spread happens to be 50 bp, the buyer of protection gets the difference between the 50 bp and 40 bp. The value is the differential times the duration of the reference asset and the notional. If the duration is 3 years, and the notional is 100, the seller pays the buyer 0.1% x 3 x 1000 = 30. If the future spread is 20 bp, the buyer of protection has to pay the differential with the forward 40 bp to the seller of the forward, or 0.2% x 3 x 1000 = 60. The seller makes a gain.
With forward spreads, there is a downside for the buyer of protection, making a credit spread put option more attractive for him. Of course, the premiums paid by the buyer of protection will be higher than with a forward contract. The buyer of protection might prefer a collar: he buys a credit spread put option and funds it partially by selling a call option on credit spreads at a different strike value of the spread.
Trading Synthetic Exposures Instead of Illiquid Cash Loans
The buy and hold practice for cash loans does not make it easy to avoid credit risk deterioration. A synthetic exposure does. The renewal of short credit derivative transactions allows us to get revenues as long as the credit standing of the reference assets remains acceptable. If the credit standing deteriorates, there is no renewal. Renewal is an option. This looks like a revolving line, except that it is synthetic and that the reference asset is not in the balance sheet of the bank. Under cash portfolio management, illiquidity might make a cash sale uneconomic.


