Credit Risk Management for Derivatives
Category: Risk Management in Banking
Financial institutions have to comply with strict rules to limit risk. For their internal management they also need better measures of risk. For instance, the limit system is adequate only if the risk measures are correct. For derivatives, the usage of risk limits is difficult to measure. The notional does not represent the actual exposure. The current exposure is the value. However, the potential exposures arise from future increases in liquidation values. If the measure of potential exposure overestimates the actual risk, the usage of credit lines hits the limit too early, which constrains the volume of business. If the measure understates the actual risk, the limits system becomes inefficient because it does not actually limit the credit risk of transactions.
Current and Potential Risks
The mark-to-market value of a swap is the discounted value of future flows indexed with market parameters. It increases if the present value of future flows increases. At inception, it is zero since the swap exchanges the prevailing market rates. Afterwards, the liquidation value changes. For instance, the value of a swap receiving a floating rate and paying a fixed rate increases when the rate increases. The reverse is true when the swap pays the floating rate and receives the fixed. Swaps have positive or negative values depending on the direction and magnitude of the changes in interest rates. The value also changes with the time to maturity. For interest rate swaps, the number of cash flows decreases when the time to maturity decreases. For currency swaps, the main flow occurs at maturity. Only intermediate interest flows amortize over time. In the end, the risk should be valued at all dates between now and maturity.
The overall risk is the sum of the current and the potential risk. The potential risk is the possible increase in mark-to-market value of the instruments due to market movements. The potential risk of upside deviations of the mark-to-market value is the add-on.
Both the current and the potential risks are time profiles of values. Even if the market parameters do not deviate from their value as of today, the swap value changes with the date due to the amortization effect and the discounting effect of future flows. The current liquidation value of the swap, as of today, does not suffice to fully capture the current risk. At all future dates until maturity, the same swap has different values even though we keep the same values of the market parameters. The swap has a time profile of liquidation values calculated with the current market parameters. The same is true with potential risk. Given a set of values of market parameters, the swap value changes at all future dates. Potential risk is also a time profile of values. In addition, there are many sets of possible market values for each future date, since these parameters are uncertain as of today.
Potential Risk
The potential risk should capture the upward deviations of market values, since only upside moves increase risk. The higher the swap value, the higher the possible amount at risk. However, there are as many future values, at any future date, as there are possible values for market parameters at those dates. As usual, a rule is required to define a maximum value.
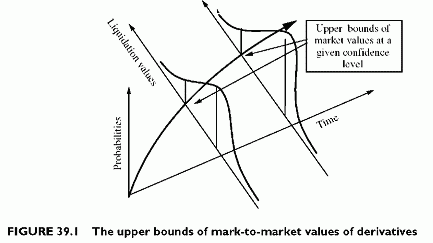
The rule is similar to that of the Value at Risk (VaR) methodology. The upper bound for the mark-to-market value of the swap is the upper bound at a given confidence level. For an individual transaction, this upper bound results from the upper or lower bounds of the underlying market parameters, modelled as a confidence interval. The upper and lower of the swap, at the same given confidence level, results from revaluation of the derivatives with these values of market parameters. For future dates, the value is mark-to-future since it requires all flows plus the forward parameters.
An example illustrates the principle. The volatility of the exchange rate of the dollar against the euro is 10%, for instance, with a current exchange rate of 0.9 EUR/USD. The volatility is therefore 0.09 EUR/USD. Under the assumption of a normal distribution of exchange rate, it will not exceed (0.9 + 0.1764) = 1.0764 EUR/USD, or the current rate plus two standard deviations, in more than 2.5% of all cases. With this upper bound for the exchange rate, a year from now, the upper bound for the currency swap is (1.0764 — 0.9)EUR/USD x 1 million USD = 0.1764 million EUR. This liquidation value is the upper bound for the mark-to-market value of the swap 1 year from now, at the 2.5% (one-tailed) confidence level.
This upward deviation of the liquidation value is the potential risk. It is also the add-on for the date considered in the calculation (1 year). The add-on is both in dollar value and as a fraction in percentage of the notional. For instance, the 0.1764 million EUR deviation of liquidation value is 20% of the notional value of the swap. It is necessary to calculate the add-ons for all future dates until maturity.
When the horizon extends beyond 1 year, the market volatility increases. It can be derived from the 1-year volatility through the formula: ot = o\*Jt, where t is in years. It is possible to refine all assumptions to accommodate the specifics of the problem. Since the horizon is long-term, pure extrapolation of current values might be inadequate. Mean reverting effects result in lower upper bounds than the above simple extrapolation rule. Nevertheless, the general methodology does not change (Figure 39.1).
When we look at the time profile generated as above, exposures reach a maximum value at a given confidence level at each time point. In fact, the probability of continuously hitting all maximum exposures at all time points is much lower than the confidence level, so the approach sounds too conservative. On the other hand, if we hit the highest potential exposure at date 1, chances are that we go beyond this exposure later, making the approach appear not conservative enough.
Formally, the probability of hitting the original maximum exposure at date 2, conditional on having hit the maximum exposure at date 1, is much higher than the confidence level corresponding to the upper bound of exposure at date 1. If the process follows a zero drift time path, the probability of exceeding the original date 2 potential exposure if we have done so at date 1 is roughly 50%, because there are roughly as many chances of going above the date 1 liquidation value at date 2 as there are of going below.
In reality, we should simulate time paths of market parameters rather than distributions at several time points. The preset confidence level becomes the fraction of time paths simulated up to date 1, up to date 2, etc. Moreover, certain derivatives look backwards because their value at a future date depends on historical values of the underlying. These require using time path simulations rather than single time point distributions. This would be more calculation intensive. Another simple way to limit the calculation of the time profile is simply to update it when moving forward in time, as illustrated in the next subsection.
Worst-case exposures serve to measure worst-case losses. When looking at expected loss, the expected exposure is a best measure. The expected exposure results from the distribution at any time point, except that positive values only are relevant. Hence, the expected exposure at this time point is the expected value of truncated distribution at the zero value.
The Time Profile of Exposure and Time Drift
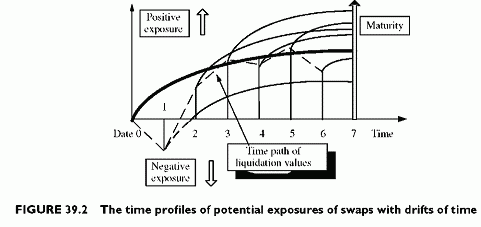
The time profile of exposure drifts with time, while current value drifts. A continuous, or frequent, update of the time profiles when time passes addresses the issue. Figure 39.2 shows several scenarios depending on whether the liquidation value increases or decreases with time. At each time point, it is necessary to revalue the entire worst-case time profile of exposure, starting from the new value. In the figure, we assume that the original exposure is zero because the derivative is a swap with a zero liquidation value at origination. The derivative is a currency swap, whose value increases until maturity, as shown in the next subsection.
The revalued liquidation serves as the basis for the new time profile, which can move downwards or upwards. If the liquidation value increases with time, the time profiles of worst-case exposures increase beyond the original values. On the other hand, negative exposures correspond to a zero risk for the bank, as illustrated by the dashed line, whenever the liquidation value is negative. The dashed straight line shows the liquidation values at revaluation time points. The exposure drops below the line at the first time points
2 The expected value of the exposure normally distributed is a/^/lit. We need to multiply this value by the notional and add any positive current value to get the expected value exposure.
then increases. Accordingly, the maximum exposure reconstructed over a time prior gets shorter when we get closer to maturity.
Implementation
Grids of add-on, expressed in percentages of notional, are credit equivalents or loan equivalents. Such grids result from the nature of the derivative (interest rate or currency swap for instance), the residual time to maturity, the volatility of the market parameters and the various forward sensitivities of the derivatives at all time points. They also depend on the current yield curves (both spot and forward) because the liquidation values are the discounted future flows using the interest rates.
Calculating Credit Risk
The total risk is the sum of the current risk and the potential risk at the date considered. For instance, the current risk at date 2 of the liquidation value, using the current market parameter values, is 10000. The add-on at the same date is 8%. If the notional is 100000, for example, the value of the add-on, or potential risk, is 8% x 1 000 000 = 8000. The overall, or total, risk at date 2 is:
Total risk = current risk + potential risk = 10000 + 8000 = 18 000
Since there is a time profile of add-ons, there is a time profile of total risk as well. Sometimes the entire time profile is used, and sometimes only the peak value is considered.


