TRANSITION MATRICES
Category: Risk Management in Banking
When time drifts, the risk either improves or deteriorates. These shifts are captured by the transition frequencies between risk classes. Within a given period, transition rates between classes are transfer frequencies divided by the number of original firms in each risk class. It is possible to map rating classes with observed credit spreads in the market. With such a mapping, we can assign different credit spreads to the final credit state, and value accordingly a loan or a bond. This allows us to generate a distribution of values at a forward horizon for any asset with a given original rating class. This is a common technique for valuing migration risk in credit risk models.
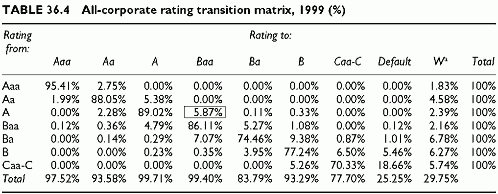
The transition matrices look as in Table 36.4. Since the higher transition frequencies occur mostly in the neighbouring classes of ratings, there is a concentration along the first diagonal of the matrix. Each row and each column is a rating class, the last one of each row being the default state. Each cell, at the crossing of initial rating A and final rating Baa for instance, provides the observed transition rate from the initial rating A to the final rating Baa, or 5.87% (cell with a border). All probabilities sum to 1 across rows because each row lists all possible final states, inclusive of the default state. The default state is an absorbing state. Once in default, there is no way out. Since the default state is an absorbing state, there is a probability of 100% of staying in the default state and zero probability of getting out. The default frequencies for all ratings are in a column at the right-hand side of the table. The last column shows withdrawn ratings. All totals by row are 100%, because the rows show all possible migrations, plus defaults and withdrawals.
The sum of all migrations to the Aaa class is: 95.41% + 1.99% + 0.12% = 97.52%. This is the total of all transition percentages leading to rating class Aaa (total of the first Aaa column). The total percentages ending in each rating class are in the bottom row of the table. Transition matrices are subject to constraints: all rows sum to 1 because they group, together with the default state, all possible migrations; all migration probabilities are positive and lower than 1.
Rating agencies publish several matrices, typically 1 year, 2 years and 5 years. Should the transition probabilities be stationary, we could simply use the same yearly matrix one, two or five times to get a final structure by risk class at the horizon of 5 years. However, the 5-year transition matrix is not a simple (matrix) multiplication of the 1-year transition matrix because transitions and default probabilities are not proportional to time.

